Three ways to supercharge your city’s open-data portal

Open-data portals—clearinghouses for data related to everything from crime stats, police incidents, and traffic collisions to zoning, planning, and real estate information—have gone online in hundreds of cities across the nation in recent years.
Now, with more city-level data available to the public than ever before, local officials are facing a new challenge: How can cities make data more relevant to regular people and, at the same time, empower citizens and neighborhood leaders to understand and make use of the information they release? As open data is institutionalized in more and more cities, officials are pushing out new types of visualizations, apps, tools, and trainings to equip people with public information they can use to hold their leaders accountable and improve their communities.
"Cities increasingly see that data is a powerful tool to engage their communities and improve outcomes," said Simone Brody, Executive Director of What Works Cities, a national initiative that helps cities use evidence and data to improve results. “This proved critical during COVID-19 as community organizations were able to utilize city data to determine where food supplies were most needed, where to locate mobile testing sites, how to best provide broadband for remote learning and work, and more."
Blake Valenta, an analytics strategist with the city of San Francisco, adds that it’s critical for cities to make data understandable for residents in order to maximize their engagement with it.
“There are weirdos like me who want to have an Excel spreadsheet thrown at them at high velocity,” Valenta said. “Other people are like, Can we do a little more work upfront to make this more interpretable?”
Three open data approaches cities are finding success with:
Map it
Much of the data that people seem to be most interested in is location-based, local data leaders say. That includes everything from neighborhood crime stats and police data used by journalists and activists to property data regularly mined by real estate companies. Rather than simply making spatial data available, many cities have begun mapping it themselves, allowing users to browse information that’s useful to them.
At atlas.phila.gov, for example, Philadelphians can type in their own addresses to find property deeds, historic photos, nearby 311 complaints and service requests, and their polling place and date of the next local election, among other information. Los Angeles city’s GeoHub collects maps showing the locations of marijuana dispensaries, reports of hate crimes, and five years of severe and fatal crashes between drivers and bikers or pedestrians, and dozens more.
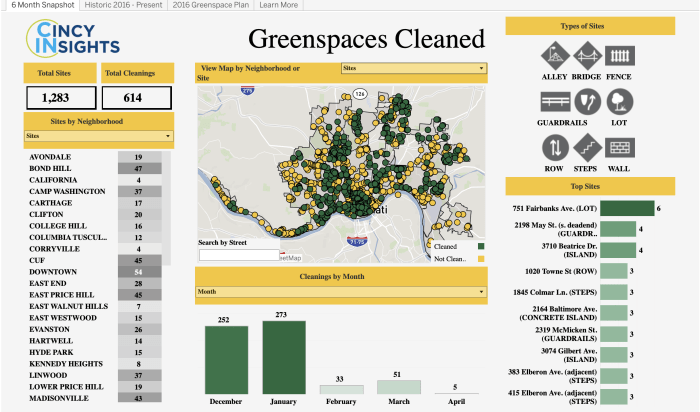
Cincinnati’s CincyInsights page gathers maps showing everything from economic-development incentives to police uses of force. The maps and tools are curated to reflect the priorities in the city manager’s strategic plan, says Kelly LaFrankie, interim director of Cincinnati’s Office of Performance & Data Analytics. Organizing data tools around those priorities—safety, efficient service delivery, growing economic opportunities, thriving neighborhoods, and fiscal sustainability—is meant to make open data more legible.
“We can make the information available,” LaFrankie says. “But the challenge is how do we get that information into the hands of the community, and how do we equip the community with the skills and know-how to be able to interpret that data and make it useful?”
Cities also have created interactive visualizations of data to help people understand what it means and how it can be used. Data SF created a Building Explorer that allows users to scan around a map of the city and click on 3D elevations of buildings to display property data. New York City’s open-data portal hosts a visualization of the prevalence of different street trees in each of the five boroughs, created by an independent user in 2015. Many cities provide interactive graphs and charts to illustrate budget revenue and expenditures. The Open Checkbook tool in Baton Rouge, La., allows users to dig through categories of spending by different agencies and identify total payments over time to individual vendors. Public polls have shown strong feedback from residents who have responded positively to being able to see granular details of city spending, including how individual neighborhoods will be affected.
Train residents on how to use it

Cities with open-data policies learn from best practices in other city halls. In the last few years, many have begun offering trainings to equip residents with rudimentary data analysis skills. Baton Rouge, for example, offered a free, three-part Citizen Data Academy instructing residents on “how to find [open data], what it includes, and how to use it to understand trends and improve quality of life in our community.” Eric Romero, the city’s director of information services, and other staff have also presented at community meetings in all of the city’s council districts, sometimes to crowds as small as one. San Francisco has offered an academy with modules on geographic information systems, data analysis, statistics, visualization tools, and project management. Cambridge, Mass., launched an Open Data User Guide in 2019.
In some communities, open-data officials work with city workers and neighborhood leaders to learn to help their communities access the benefits of public data even if only a small fraction of residents are accessing the data itself.
In Philadelphia, city teams work with the Citizens Planning Institute, an educational initiative of the city planning commission, to train neighborhood organizers in how to use city data around things like zoning and construction permits to keep up with development in their neighborhoods, says Kistine Carolan, open data program manager in the Office of Innovation and Technology. The Los Angeles Department of Neighborhood Empowerment runs a Data Literacy Program to help neighborhood groups make better use of the city’s data. So far, officials say, representatives of 50 of the city’s 99 neighborhood councils have signed up as part of the Data Liaisons program to learn new GIS and data-analysis skills to benefit their neighborhoods.
Leverage the COVID moment
The COVID-19 pandemic has disrupted cities’ open-data plans, just like it has complicated every other aspect of society. Cities had to cancel scheduled in-person trainings and programs that help them reach some of their less-connected residents. But the pandemic has also demonstrated the fundamental role that data can play in helping to manage public emergencies. Cities large and small have hosted online tools that allow residents to track where cases are spiking—tools that have gotten many new people to interact with public data, officials say.
“One of the ways to relieve uncertainty is with information, and open data can play a role in that,” Valenta says.
In Los Angeles, the city’s data office not only has maintained maps of new cases and vaccine distributions, but also tracked where free meals and cash assistance have been distributed. Sharing data about the pandemic also has helped uncover underlying inequities in many urban spaces, says Tim Moreland, director of performance management and open data for the city of Chattanooga, Tenn. And more people have gotten used to the idea of using data to understand their communities, and how they can be improved.
“It has made people more data-literate,” Moreland says. “People are more used to seeing data visualizations and looking to data to understand what’s happening, and just thinking about data in relation to their everyday lives.”
In Baton Rouge, Mayor Sharon Weston Broome credited open data with the city’s ability to share critical information about COVID-19, set up testing sites, and identify critical trends to inform decision making. As Mayor Broome notes, “Good data helps build trust with your community and build a tremendous amount of credibility with our citizens.”
The public's response to the availability of open data also has helped quell reservations some cities have had about releasing information to the public, even as open-data policies have proliferated. Often, many open data proponents say, those fears were based on a belief that the public would voraciously consume the information and inundate decision-makers with questions, complaints, and requests for more.
Moreland says that in reality, the opposite has often been the case. Residents do devour the data but rather than come back with complaints or questions, they appear to be focusing on using it in their lives.
“This is the big irony of open data and government,” he says. “When you’re trying to open up data, oftentimes there’s a lot of pushback. People are afraid that everyone’s going to see our data and they’re going to know everything, they’re going to question everything, and they’re not going to be able to understand the context and it’s just going to be a huge nightmare, and the sky is falling. And then what happens is we release the data, and there’s crickets.”


