9 Ways cities can use data for results

When it comes to using data in city hall, it’s not the numbers that matter but what you do with them.
That’s something a growing number of mayors and city leaders understand. Increasingly, they’re pushing data analysis into the heart of decision making, using it to track their progress on key priorities, save taxpayer dollars, and create an open dialogue with citizens.
Today, nine cities are being recognized for excellence in their use of data to make local government more effective, efficient and accountable. They are receiving Certification through What Works Cities, a Bloomberg Philanthropies initiative that helps American cities ingrain data collection, analysis and transparency into everything they do. This certification is designed to both provide a benchmark for cities to aspire to, and to recognize those cities who have already successfully aligned their practices and policies with a rigorous national standard for applying data and evidence to the work of local government.
Below are the nine cities — and one innovative example from each showing how they’re using data to improve local services. While this list highlights individual strategies, what elevates these cities above the rest is the comprehensiveness of their approach to integrating the use of data into the business of government.
Boston
The most famous scoreboard in Boston is at Fenway Park, where the city’s Red Sox play baseball. The second most famous is on a large screen in Mayor Marty Walsh’s office. The screen boils down the daily performance of key city services, such as time to answer 311 calls, ambulance response time, crime stats, and more. There’s also one aggregate score that represents an overall measure showing whether the city is exceeding or missing its targets that day. The CityScore initiative puts all this data online for residents to see. The layout is designed to resemble the scoreboard at Fenway.
Kansas City, Mo.
Some of the most important data Mayor Sly James is using comes directly from the city’s residents. On a quarterly basis, Kansas City conducts a citizen-satisfaction survey, taking the public’s pulse on priorities. The information feeds directly into the city’s planning processes and often leads directly to action. For example, a 2016 survey turned up widespread frustration with blighted buildings, prompting the city to propose — and voters approve — a $10-million bond measure to pay for the work of demolishing them. Survey data also built the case for an $800-million bond to fix up roads, bridges, and sidewalks, which voters approved last April.
[Read: The mayor behind Kansas City’s data revolution]
Los Angeles
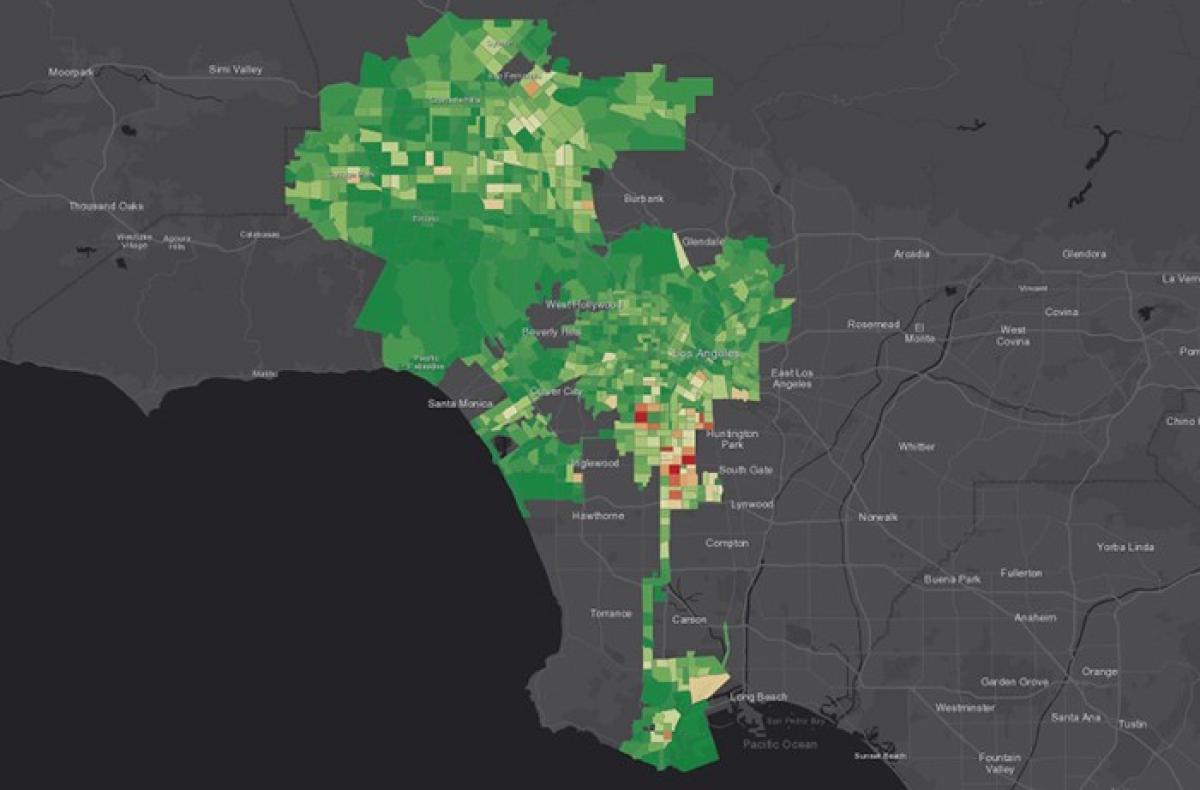
When Mayor Eric Garcetti pledged to clean his city’s streets, setting priorities was a must. In such a massive, sprawling city, even an intensive effort could have a limited payoff. To guide the effort, crews from the Bureau of Sanitation began driving every public street and alleyway, assigning each block a cleanliness score. They then went to work on hauling illegally dumped sofas, tires, and other litter off the streets that needed it most. Just one year after launching the Clean Streets Index, the city had already reduced the number of unclean streets by 82
Louisville, Ky.
In 2013, Mayor Greg Fischer signed a groundbreaking executive order declaring public records to be “open by default,” while creating easy public access to the information. What was missing was a public space to foster collaborative ways of using all that data. So the city created Louielab, an innovation hub and co-working space where city employees, members of the civic tech community, and other innovators can mix. The space includes work stations for the city’s Office of Performance Improvement and Innovation, as well as an open area for events and meetings. A recent hackathon held at Louielab produced a pathway to ask Alexa, Amazon’s voice-activated home assistant, for crime data from the city’s open data portal.
New Orleans
Under Mayor Mitch Landrieu, New Orleans created a powerhouse of data analytics capabilities in its Office of Performance and Accountability. Now, that office is serving as something of an in-house consulting unit, partnering with other departments on data-related projects. Through the “NOLAlytics” initiative, departments pitch data projects that could help them achieve their strategic goals. Completed projects include an analysis of traffic safety cameras and an assessment of optimal locations for placing ambulances.
San Diego
San Diego wanted to give residents an alternative to 911 for non-emergency service requests. While creating a 311 line was an option, a city survey found that 83 percent of respondents didn’t want to have to make a call to report a problem. So Mayor Kevin Faulconer’s administration created Get It Done, an app that not only lets residents send in photos of broken parking meters, graffiti, and other nuisances, but also automatically tags those photos with address information when they’re uploaded. City response crews close the loop by sending “after” photos back to residents.
San Francisco
When the late mayor Ed Lee decided he wanted to embed the use of data into the city’s work culture, he also realized that it would require skills that many city employees or managers don’t have. So the city’s DataSF team partnered with the Office of the Controller to launch DataAcademy, a training program just for city employees. The course catalog includes everything from a basic introduction to Excel spreadsheets to courses on project management, reading statistics, and data visualization.
Seattle
As Seattle battles a growing homelessness problem, it’s also rethinking how it contracts for housing services. Beginning with a pilot of $8.5 million worth of contracts, the city began requiring that contractors be held accountable for outcomes, such as placing individuals into permanent housing, rather than actions, such as feeding and temporarily housing them. When data showed positive results, Seattle expanded that pilot to $34 million in contracts. The result: The city’s not only getting a bigger bang for its buck, it’s expected to double the number of people moving into permanent housing.
Washington, D.C.
To boost the District’s data capacity, Mayor Muriel Bowser created an in-house data science team known as The Lab @ DC. The lab conducts applied research to test assumptions and injects scientific thinking into day-to-day operations. For example, the Lab designed and conducted a study of police body-worn cameras. One of the largest and most rigorous studies of its kind so far, it found that the cameras have no detectable, meaningful effect on the use of police force.


