Fighting displacement with data

Housing stability was a critical issue for city halls even before COVID-19, and nowadays the concern is magnified several times over. While eviction moratoriums and rental assistance during the pandemic have helped prevent more than a million evictions, city officials know they need to work harder to avoid a displacement tsunami that, if it strikes, would hit their most vulnerable residents the hardest.
That’s why an increasing number of city leaders are turning to one of the most powerful innovation tools at their disposal—data—to take their displacement-related efforts to new heights. As a result, they’re gaining a better understanding of who’s at risk and are using the insight to inform more effective prevention strategies.
“This idea of mapping the risk [of displacement] has really taken off,” says Karen Chapple, faculty director of the Urban Displacement Project at the University of California at Berkeley, which has made its own maps of gentrification and displacement in several cities around the world. But, Chapple adds, “there are big-picture questions cities need to think about: Are [the tools they’re using] accurately identifying where risk is? And are people able to use these tools in a meaningful way to effect policy change that works?”
With those considerations in mind, here’s a look at how three cities—Denver, Colo., Austin, Texas, and Atlanta—are upping their data game to fight displacement.
Denver: Predicting the impact of capital investments
When cities invest in parks, public spaces, and other neighborhood amenities, those improvements can also inadvertently lead to displacement by driving up property values and rents. Denver is using an innovative approach to spot that before it happens.
A multi-disciplinary team from across city departments developed a dashboard that shows an array of demographic and housing data across Denver’s 78 neighborhoods. Then, the city hired a consultant to develop a “change model” in order to understand how city investments affect property values and rents. For example, the model projects that a bus-rapid transit project in the works would raise rents within a relatively small impact radius—about 100 feet from a bus station; by contrast, a large roadway reconstruction would raise rents and property values across a much larger area.
The tool also shows the demographics and characteristics of those who will be affected by a city investment. This knowledge helps city planners choose wisely from their “policy playbook” of anti-displacement interventions. Rent-assistance strategies might be what’s needed in neighborhoods with older residents on fixed incomes, for example, while neighborhoods with a lot of families living on low incomes might need larger apartments.
Another key strategy is to engage residents for feedback. One example is in the neighborhood of East Colfax, which has a large immigrant and refugee population and is also one of the neighborhoods that will be affected by the bus-rapid transit project. Interview data showed that what residents said they needed wasn’t necessarily just new anti-displacement programs, but language services like translation and interpretation to help them access existing programs. That feedback pointed the city toward enhancing language services in the neighborhood for residents to better access the city’s Financial Empowerment Center, which offers free financial counseling that can help residents strengthen their financial footing so they can stay in their current homes.
Connecting the dots between data and strategy is essential, explains Analiese Hock, a principal planner who recently presented Denver’s model to other cities through the Local Housing Solutions network. “It’s fun to look at the model and to get into the data,” she says, “but where data tools are important is creating policies and programs that actually meet the residents in the community where they are at and provide them with the ability to be stabilized and be able to enjoy city improvements.”
Austin: A targeted approach
Last fall, voters in Austin approved a $7-billion, multi-year plan to increase bus and rail transit, parts of which will run through neighborhoods with histories of segregation and disinvestment. In preparation, the city is working to get ahead of potential displacement.
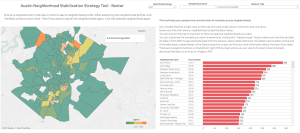
Underpinning the effort is a data-driven initiative by Austin’s innovation team. The i-team created a Neighborhood Stabilization Strategy Tool, a map that displays displacement risk factors such as age, income, and the composition of renters or homeowners, down to the Census-tract level. An additional tool to guide the project, the Equity Tool, is based on the Neighborhood Stabilization Strategy Tool and will empower the city to look at displacement related to a combination of risk factors.
Ultimately, these data will inform the specific strategies aimed at preventing displacement. For example, the Equity Tool might signal a need for childcare or rental assistance, or a pocket of older homeowners who need help with home repair or weatherization. Austin also is building a dashboard that will track displacement over time—helping the city recognize whether its interventions have been effective.
“One-size-fits-all solutions are not typically that effective at preventing displacement,” Acting Chief Innovation Officer Daniel Culotta says of this targeted strategy. "Our hope in taking a context-sensitive approach is that we can target these services and resources and work with communities directly more effectively than we would by creating an overarching policy.”
Atlanta: Seeing displacement more clearly
As population growth and rising housing prices hit Atlanta at the same time, city leaders are comparing recent changes with local history to better understand what policies have facilitated residential segregation and sprawl in the past—and how to avoid those outcomes in the future.
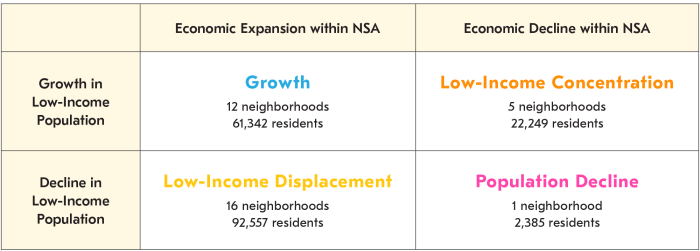
The result is Atlanta’s recently published Neighborhood Change Report, which charts demographic change in the growing city between 2010 and 2018. The report, which analyzed four kinds of neighborhood change—low-income displacement, low-income concentration, population growth, and population decline—found that more than a third of the city’s residents lived in a neighborhood that experienced substantial change.
While displacement of people with low incomes was the most common change experienced, a number of other neighborhoods experienced population growth without evidence of displacement. “We know there’s not only one kind of trajectory neighborhoods are on,” explains Kendra Taylor, project manager for the Office of Housing and Community Development.
Josh Humphries, director of the Office of Housing and Community Development, adds that it can be easy to “bake assumptions” about gentrification into research methodology, like assuming that a new development or park is necessarily displacing people. “We wanted to avoid that data bias,” he says, and “let the data lead the way.”
One way the city is now responding is with inclusionary zoning, which requires a portion of newly constructed housing in certain fast-growing neighborhoods to be affordable to residents with low or moderate incomes. Atlanta is also looking to use stabilization tools, like funds to cover property taxes in neighborhoods where homeowners could be at risk of displacement due to increasing property values.
“I don’t think there’s one policy that solves displacement,” Humphries says. “It’s a thousand little solutions. And all of those little solutions help us to make a healthier city.”


