5 ways cities can use the Racial Wealth Equity Database

The large wealth gap between Black and White families in America has persisted for generations—and mayors are determined to find ways to finally address it.
In the most recent Menino Survey of Mayors, 67 percent of mayors said they are worried about the racial wealth gap in their cities. Of those mayors, overwhelming majorities support targeted programs to help Black and Latino residents build businesses and increase homeownership.
When city leaders get down to designing new policies and programs, however, they quickly discover a problem. The data they need to inform their efforts—local-level data on assets, homeownership, and more—can be difficult to find broken down by race.
That’s why Bloomberg Philanthropies’ Greenwood Initiative launched the Black Wealth Data Center, a new go-to resource for this critical information, in September. The platform features a new Racial Wealth Equity Database and gives local leaders, among other users, free and easy access to data they need to design new solutions aimed at addressing the wealth divide.
“Local leaders need high-quality data disaggregated by race to inform the design of equitable programs and policies,” says Garnesha Ezediaro, who leads Bloomberg Philanthropies’ Greenwood Initiative. “This new platform aims to ease accessibility to race-based data and empower evidence-based decision making amongst leaders developing racial wealth equity initiatives.”
[Read: 4 ways data can help cities become more equitable]
The Racial Wealth Equity Database brings a number of federal, state, and local datasets that are disaggregated by race together in one location. There are data on assets and debt; business ownership; education; employment; home ownership; and population demographics.
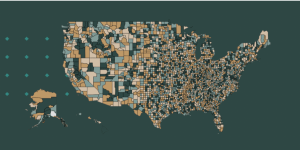
For each subject, users can look at national trends, or drill down into and compare details by state, county, or ZIP code, and download easy-to-share visualizations. The database is continually refreshed as new data become available, and new functionality will be added based on user feedback. A new tool launched today allows county-level data from across the datasets to be viewed in one place. (Join a webinar on Dec. 6 at 1 pm ET to learn more about this new Black Wealth Indicators tool.)
To learn more about how local leaders can use this powerful tool, Bloomberg Cities spoke with Harsha Mallajosyula, the Black Wealth Data Center’s Director of Data.
Mallajosyula is a familiar face to local government innovators, having previously served as Chief Data Officer in Paterson, N.J., and Senior Data Scientist in Los Angeles. He described five key ways local leaders can use the Racial Wealth Equity Database as they craft and communicate new policies and programs.
1. Boosting homeownership. Owning one’s home is a critical path to building wealth. Local leaders can use the Racial Wealth Equity Database to see data on homeownership by county or by ZIP code, disaggregated by race. “This is a great map if you’re working in a mayor’s office and interested in increasing Black homeownership rates,” Mallajosyula explains. The data, he adds, can be a jumping off point for figuring out what neighborhoods most need resources or where to focus efforts on building community partnerships around increasing homeownership.
2. Addressing social vulnerability. As COVID spotlighted, some communities are more vulnerable to shocks and stresses than others. Local leaders can use the tool to see a measure of their county’s social vulnerability produced by the U.S. Centers for Disease Control. Mallajosyula points to Hinds County, Miss., where the biggest city, Jackson, recently suffered a water infrastructure crisis. The county’s population is 73 percent Black and its Social Vulnerability Index of 0.874 is extremely high. “Counties and cities can use this information to start planning ahead in terms of infrastructure- and climate-related risks,” Mallajosyula says. “There’s a big intersection between climate change and the impact it’s having on Black households.”
[Read: Leading confidently with data: 3 steps for every city leader]
3. Closing the digital divide. Gaps in broadband internet access deeply impacted Black households when schools and workplaces were shut down during the pandemic. Now, as communities seek to leverage federal funds to fill those gaps, local leaders can use the Racial Wealth Equity Database to see what communities need support most. The tool can show the percentage of households within a county of ZIP code that have a broadband internet subscription, broken down by race. The data come from the U.S. Census Bureau’s American Community Survey. “This helps in understanding where the disparities lie,” Mallajosyula says. “Even within ZIP codes where there’s a low rate of broadband access, you still see stark disparities between White, Asian, Black, and Hispanic households.”
4. Preventing evictions. As local leaders address rising rents, the Racial Wealth Equity Database offers a view on where rent burdens are highest. The tool includes a searchable map down to the ZIP Code level with data on household incomes by race and the percentage of household income spent on rent. Places where households spend more than 30 percent of their incomes on rent are typically at higher risk of renters seeing displacement. “With inflation and rents going up and eviction moratoriums expiring, there’s a lot of conversation around which communities are at risk for displacement,” Mallajosyula says. “This is a tool policymakers can look at to see where the highest risks are.”
5. Telling the story. To build the case for change, local leaders not only need to have access to data but also to communicate with it. It’s by telling stories with the numbers that they can show where racial disparities must be addressed and demonstrate a need for bold action. The Racial Wealth Equity Database makes this easy. Users can quickly download maps as an image, PDF or PowerPoint slide; those images can also be easily shared to Twitter or Facebook. “We understand that a lot of cities don’t have their own chief data officer or a data scientist to build maps like this,” Mallajosyula says. “With this tool, a policy analyst or others in a mayor’s office can now have access to all this information and create these visualizations.”


